
Picking your battlefield: choosing the right market and timeframe before you trade a single setup
This article explains how market characteristics and timeframes can affect
a trader’s decision-making. It is provided for educational purposes and
does not constitute financial or trading advice.
Understanding that markets function as auctions influenced by liquidity
is the theory. Applying that understanding requires a much more practical
decision: choosing which market to trade and which timeframe to use.
A trader can understand price action well and still struggle if the market
or timeframe does not suit their strategy, temperament or available time.
Choosing the trading environment is therefore part of the trading process,
not something that should be treated as an afterthought.
Not All Markets Behave the Same Way
The underlying principles of price behaviour may be similar across
financial markets, but volatility, liquidity and structure can vary
significantly between instruments.
Before concentrating on any particular market, four characteristics are
worth considering:
- Liquidity
- Consistency of volatility
- Clarity of market structure
- Trading costs, including spread and execution
How These Factors Differ Across Markets
Major Currency Pairs
Major currency pairs such as EUR/USD and GBP/USD are among the most
actively traded financial instruments.
Their deep liquidity can contribute to relatively competitive spreads
and efficient execution under normal market conditions.
Their market structure can also be relatively clear compared with some
more volatile instruments, which can make major currency pairs a useful
environment for traders who are still developing their understanding of
price action.
Stock Indices
Stock indices such as the US100, GER40 and US500 can operate in a
considerably faster volatility environment.
Price can move sharply, particularly around the opening of major trading
sessions, economic releases and significant market events.
This can provide opportunities for trend-following strategies, but the
increased speed of movement also means risk and position size need to be
managed carefully.
Commodities
Commodities include instruments such as gold, silver, copper and crude oil,
but they should not all be treated as though they behave identically.
Gold is highly traded and can provide relatively clear periods of trending
and structural price behaviour. It can nevertheless become extremely
volatile around major economic releases, geopolitical developments and
changes in interest-rate expectations.
Crude oil can behave very differently. Sharp movements can occur around
inventory data, geopolitical events and changes in global supply and demand.
That volatility can create opportunity, but it also increases the importance
of disciplined risk management.
Cryptocurrencies
Cryptocurrencies such as Bitcoin and Ethereum can experience substantial
volatility.
Liquidity can vary significantly depending on the asset, exchange and time
of day. Price behaviour can also be highly impulsive, particularly during
periods of intense speculation or significant market news.
Higher volatility creates potential opportunity, but it also increases
potential risk. Traders therefore need to understand the characteristics
of the specific cryptocurrency market they intend to trade rather than
treating the entire asset class as one market.
Start With One or Two Markets
A trader does not need to monitor dozens of instruments.
Concentrating on one or two markets can make it easier to observe how those
instruments behave during different sessions and market conditions.
Over time, traders often begin to recognise recurring characteristics in
volatility, speed, reaction around important levels and behaviour around
economic events.
This is sometimes described as learning the market’s “personality”.
While markets are always changing, familiarity can help a trader understand
what is normal and what represents unusual behaviour for a particular
instrument.
Choosing a Timeframe That Fits You
A timeframe defines how much time each candle on a chart represents.
This can range from one minute to one month or longer.
There is no universally correct timeframe. The appropriate choice depends
on trading style, temperament, strategy and how much time a trader can
realistically dedicate to monitoring the market.
Scalping — M1 to M5
Scalping generally involves very short-term trades lasting from seconds
to minutes.
It can require continuous concentration, fast decision-making and the
ability to manage frequent changes in price.
Trading costs can also become particularly important because a trader may
execute a larger number of transactions.
Day Trading — M15 to H1
Day traders generally open and close positions within the same trading day.
This approach usually requires the trader to monitor the market during
particular sessions while waiting patiently for appropriate conditions
and setups.
Closing positions before the end of the trading day can also reduce
exposure to overnight market movements, although it does not remove
normal trading risk.
Swing Trading — H4 to D1
Swing trades can remain open for several days or potentially weeks.
Higher timeframes may therefore be more practical for traders with jobs,
businesses or other responsibilities who cannot continuously monitor
short-term market movements.
The trade-off is that positions can remain exposed to overnight events,
market gaps and changes in conditions between trading sessions.
Why One Timeframe Is Not the Whole Picture
Choosing a primary timeframe is only part of the process.
Looking at one chart in isolation can hide important information about
the broader market structure.
A move that appears significant on a five-minute chart may represent only
a small correction within a much larger daily trend.
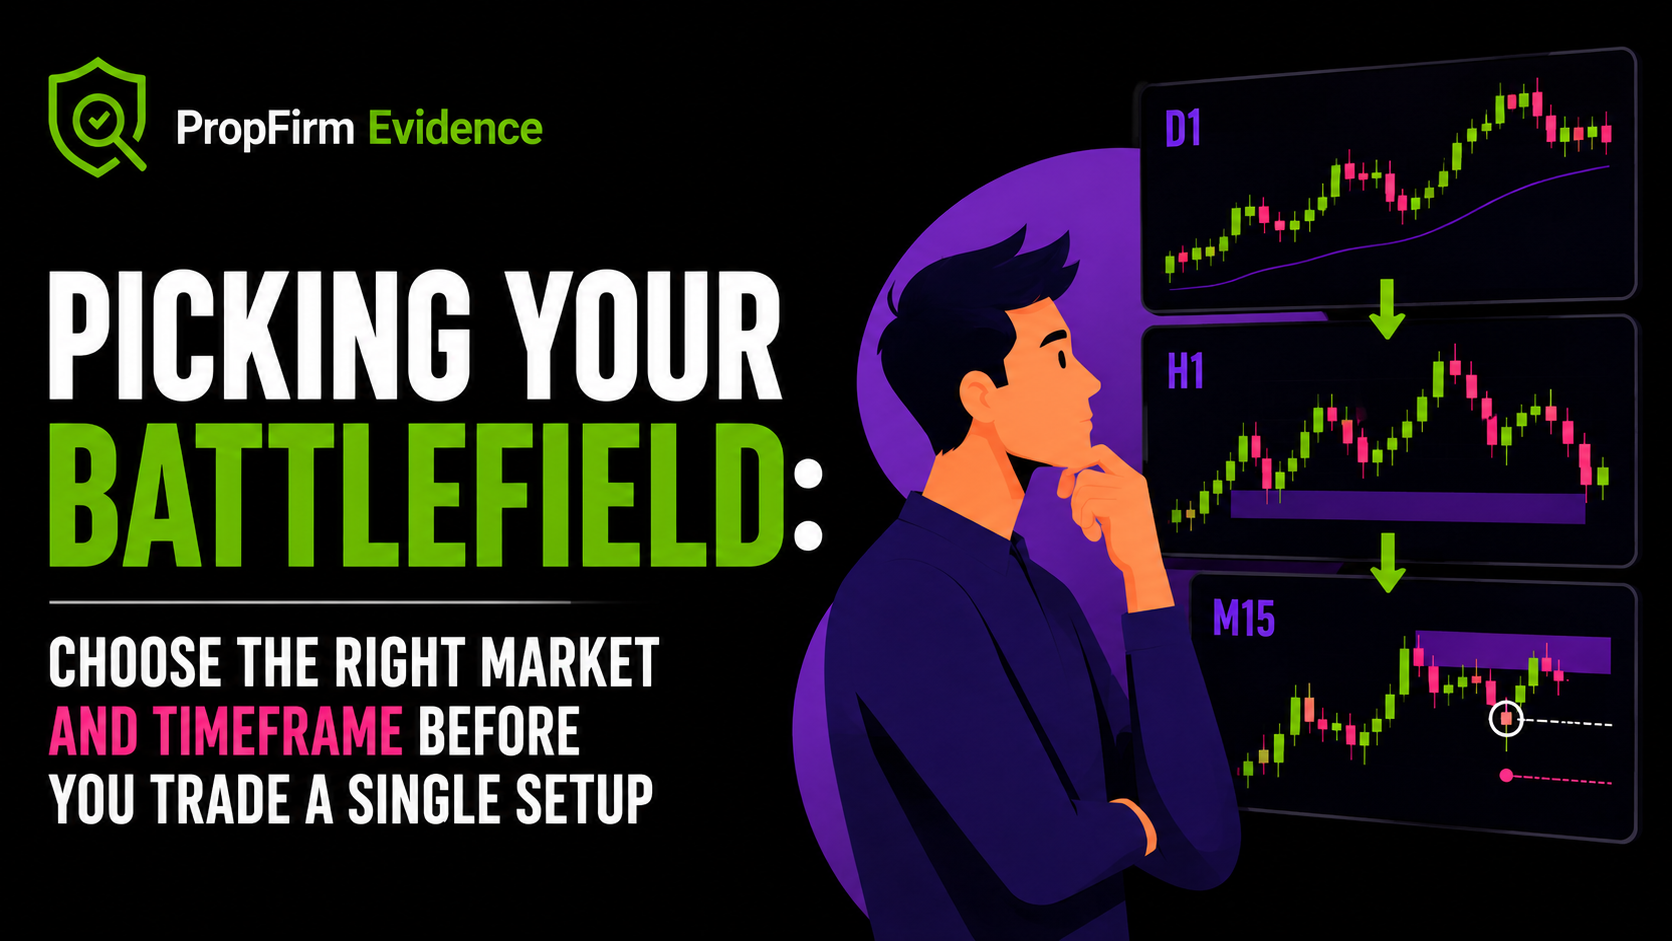
This is why many traders use some form of multi-timeframe analysis.
What Multi-Timeframe Analysis Does
Multi-timeframe analysis means examining the same market across more than
one timeframe in order to understand both the broader context and the
shorter-term price behaviour.
In a simple approach, the timeframes can have two different roles.
Higher Timeframe — Context
The higher timeframe can be used to identify:
- The broader trend or directional environment
- Major areas of support and resistance
- Important structural highs and lows
- Areas where significant price reactions have previously occurred
Lower Timeframe — Execution
The lower timeframe can then be used to examine shorter-term structure
and identify a potential entry.
Using a more precise entry timeframe may allow a trader to define risk
more accurately, but a smaller stop does not automatically make a trade
better. The stop still needs to reflect the structure and volatility of
the market.
What This Comes Down To
Less can be more.
Instead of monitoring dozens of charts, begin with one or two markets
and learn how they normally behave.
Respect the characteristics of each market.
Different instruments have different levels of liquidity, volatility
and trading costs.
There is no perfect timeframe.
Choose a timeframe that fits your strategy, temperament and the amount
of time you can realistically spend trading.
Connect the timeframes.
Use the higher timeframe to understand context and the lower timeframe
to examine potential execution.
What Comes Next
Once the market and timeframe have been selected, the next step is learning
how to read the behaviour of price itself.
The following article will examine the fundamentals of price action,
common forms of market movement and the structural patterns traders can
use when developing a trading methodology.