
Reading price like a language: market structure and the patterns that actually matter
Knowing which market to trade and which timeframe to trade it on tells you where and when to look. It doesn’t tell you what to actually look for once the chart is open. That’s the job of price action, and it’s worth learning to read directly, instead of outsourcing that reading entirely to a lagging indicator.
What Price Action Actually Is
Price action is the study of price movement itself over time, using the raw candles rather than a derived formula like RSI or MACD.
Where an indicator gives you a calculation built on top of price, price action gives you the thing the calculation was built from, a direct read on the ongoing negotiation between buyers and sellers.
It’s closer to a language than a signal, and like any language, it rewards fluency over memorization.
Market Structure: The Shape That Tells You Who’s in Control
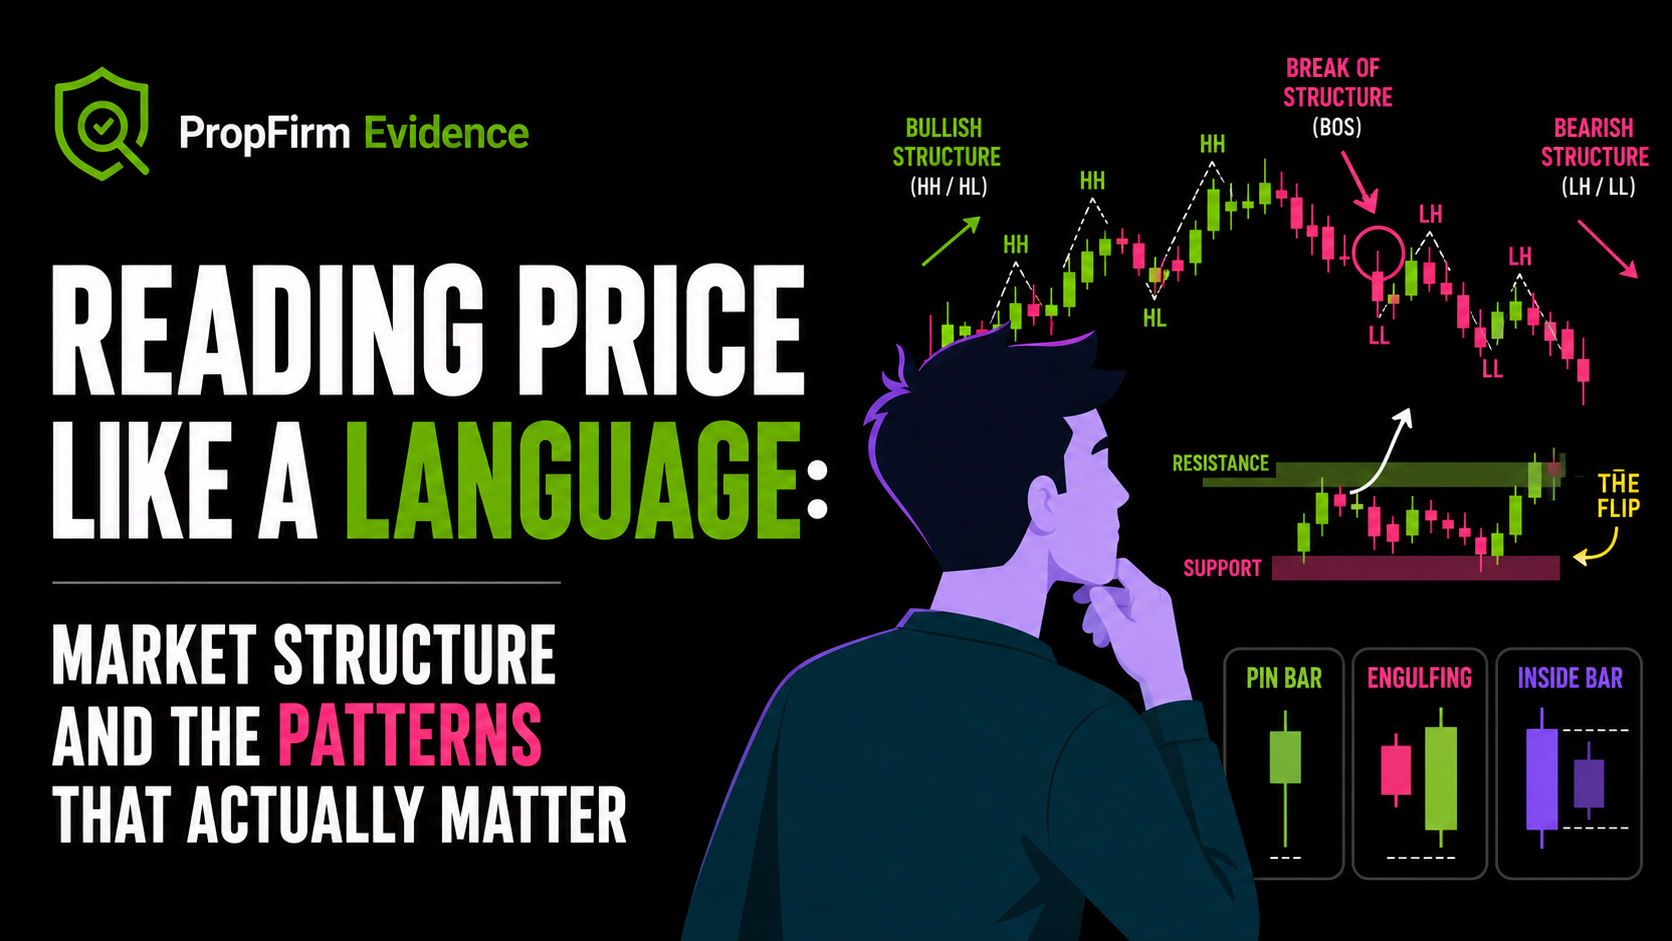
Before looking for any individual trade, you need to know which side currently controls the market. Structure is defined by the relationship between swing highs and swing lows:
Bullish structure (uptrend): a sequence of higher highs (HH) and higher lows (HL). Buyers are in control.
Bearish structure (downtrend): a sequence of lower highs (LH) and lower lows (LL). Sellers are in control.
Range (sideways): price moves within a horizontal corridor, typically signaling a period of accumulation or distribution while larger participants build their positions quietly.
Break of Structure: The First Warning a Trend Is Changing
A trend remains valid only until its structure actually breaks.
In an uptrend, if price fails to print a new higher high and instead drops below the prior higher low, that’s a break of structure (BOS), the earliest concrete signal that the trend may be reversing, well before any indicator would confirm it.
A Handful of Patterns Worth Actually Mastering
You don’t need fifty candlestick patterns memorized to trade well, you need a small set of high-probability patterns that reveal a genuine imbalance between supply and demand.
Pin Bar
A small body with a long wick tells a specific story of failed intent: a long lower wick shows sellers pushed price down, only to run into a wall of buy orders that shoved it right back up.
It represents a sharp rejection of a particular price level.
Engulfing Pattern
This happens when one candle’s range completely swallows the previous one.
A bullish engulfing candle, a large green candle following a small red one, shows buyers overwhelming sellers within a single period, and reads as an immediate signal of momentum shifting.
Inside Bar
A candle that stays entirely within the range of the one before it (the “mother candle”) represents a squeeze, consolidation and compressed volatility.
A breakout from an inside bar frequently leads into a sharp, impulsive move, precisely because the compression had to resolve somewhere.
Support and Resistance: Psychological Boundaries, Not Fixed Lines
Price action works best in zones of genuine interest.
Beginners tend to see support and resistance as arbitrary lines; experienced traders see them as areas of institutional and psychological consensus, places where the balance of power has visibly shifted before.
Support functions as the market’s floor. When price returns to it, a rise in buying interest halts the decline and pushes price back up.
Resistance functions as the market’s ceiling, a level where price starts to look expensive. As sellers take profit and larger participants open fresh short positions, a wall of supply forms that keeps price from climbing further, at least for a while.
The Flip: One of the Most Reliable Signals in Trading
Once a resistance level actually breaks, the psychology around it flips.
Traders who sold at that resistance are now underwater and regretting the position; when price returns to revisit that same level, it no longer behaves like resistance, it behaves like new support, because the same participants who sold there before are now more inclined to buy back or add.
What This Part Comes Down To
Price is the primary indicator. Everything else, RSI, MACD, moving averages, is secondary; the real structure and movement of price tells the actual story.
Structure overrides everything. Never trade against the prevailing structure. If structure is bearish (LH/LL), looking for buying opportunities is a low-probability approach regardless of how attractive any single candle looks.
Draw zones, not lines. The market isn’t a precision instrument. Use rectangles to mark support and resistance areas rather than pretending a single price level is exact.
What Comes Next
The next part in this series moves into the most critical pillar for long-term survival: risk management.
We’ll look at how to balance your win rate against a properly chosen risk-reward ratio to build a genuinely positive mathematical expectancy, and how to manage capital so that a handful of losing trades never ends your run before it really gets going.